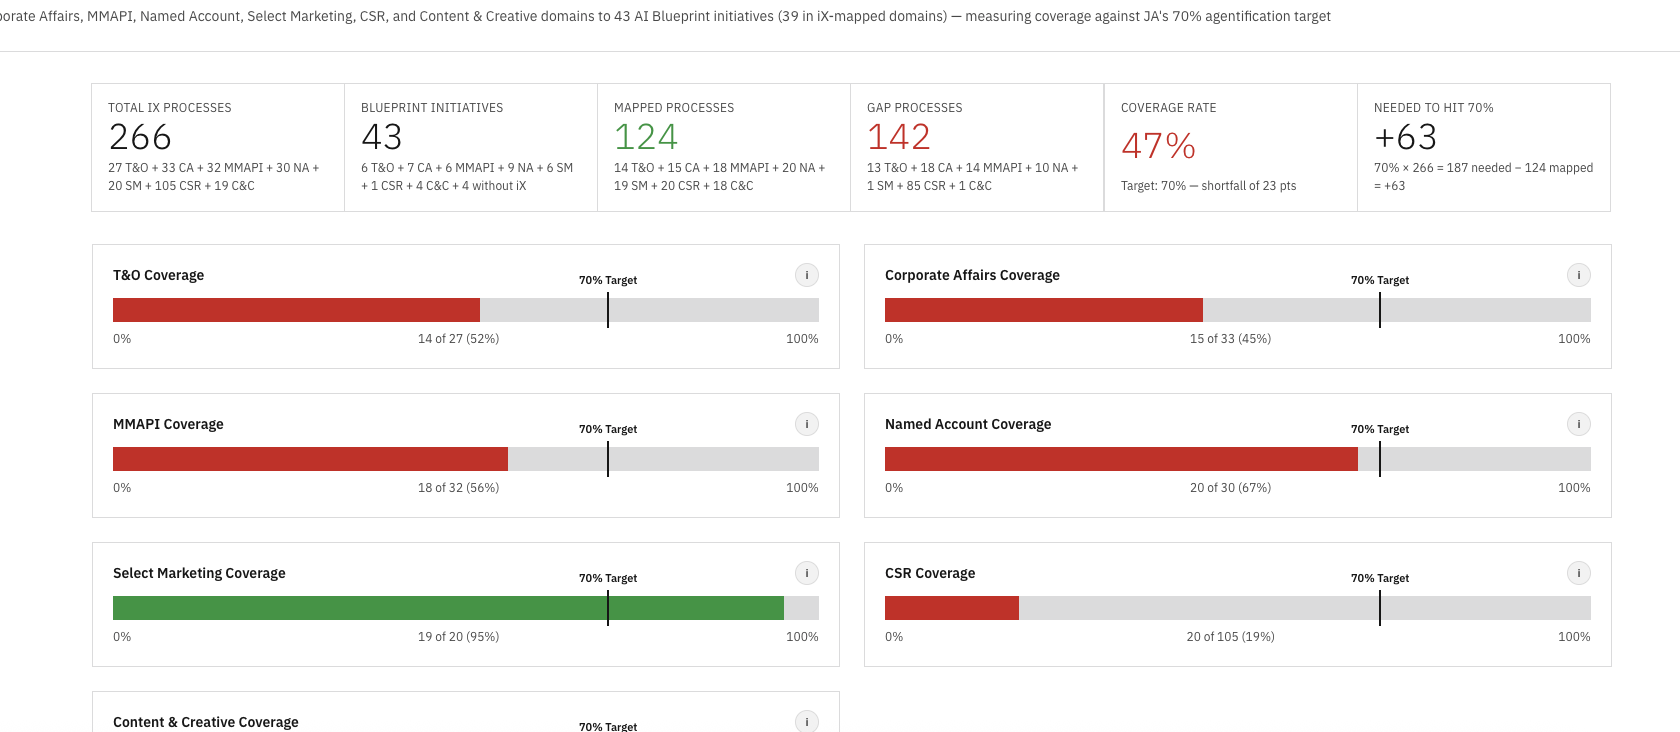
Combined coverage view: 321 workflows, 252 mapped, 69 gaps, 82% aggregate coverage — twelve points above the 70% agentification target.
This case study covers in-progress client work and is gated. If you have the password, enter it below.
Request access → ← Back to workTook 321 discovered workflows across nine enterprise domains, mapped them against 41 AI Blueprint initiatives, measured coverage against a 70% target, and shipped the entire analysis as a live multi-page Railway site.
IBM's Marketing Communications Center engagement produced two parallel streams of work that never met in the middle. The strategy team had built an AI Blueprint of 41 transformation initiatives across nine enterprise domains. Separately, an iX discovery effort had documented 321 existing workflows in PDF form, one domain at a time, with no consistent format and no way to query across them.
The blueprint lived in a master Excel and a strategy deck. The discovery lived in a folder of PDFs with names like Operations_E2E_Process.pdf and CSC_E2E_Process_Flow.pdf. Both sides were meticulous. Neither side could answer the one question stakeholders kept asking: how much of what we already do is covered by what we plan to build?
Answering that meant reading 321 workflow descriptions, holding 41 initiatives in your head, and mapping them by intent, tooling, stakeholder, and outcome. Doing it once was a multi-week effort. Doing it every time a new domain landed was untenable. So nobody was doing it, and the coverage story stayed invisible at exactly the moment leadership needed it most: heading into the agentification investment review.
I took it on as side work to make the relationship visible and, more importantly, to build a system where it could stay visible without re-doing the work each cycle.
Manually mapping 321 workflows would have taken weeks and decayed the moment a new domain landed. Instead I built the work as a repeatable system: a custom Claude Code skill that handled extraction, normalization, mapping, scoring, and rendering end-to-end. Each new domain runs through the same pipeline, produces output in the same format, and ships to the same Railway service. The work compounds instead of restarting.
I want to be precise about what "AI did the work" means here, because it's almost always the wrong framing. The AI didn't make the strategic decisions. I designed a system where the strategic decisions could happen reliably and at scale. Claude Code was the runtime. The skill encoded my judgment, my prompts, my mapping rubric, and my output format. The value lives in the skill, not in any single domain's mapping.
ix-{domain}.html fragment matching the site's design system: header with summary stats, coverage bar against the target, a card grid of every blueprint initiative with mapped process counts, and the per-process mapping list. Drop it into the deploy folder, push to Railway, done.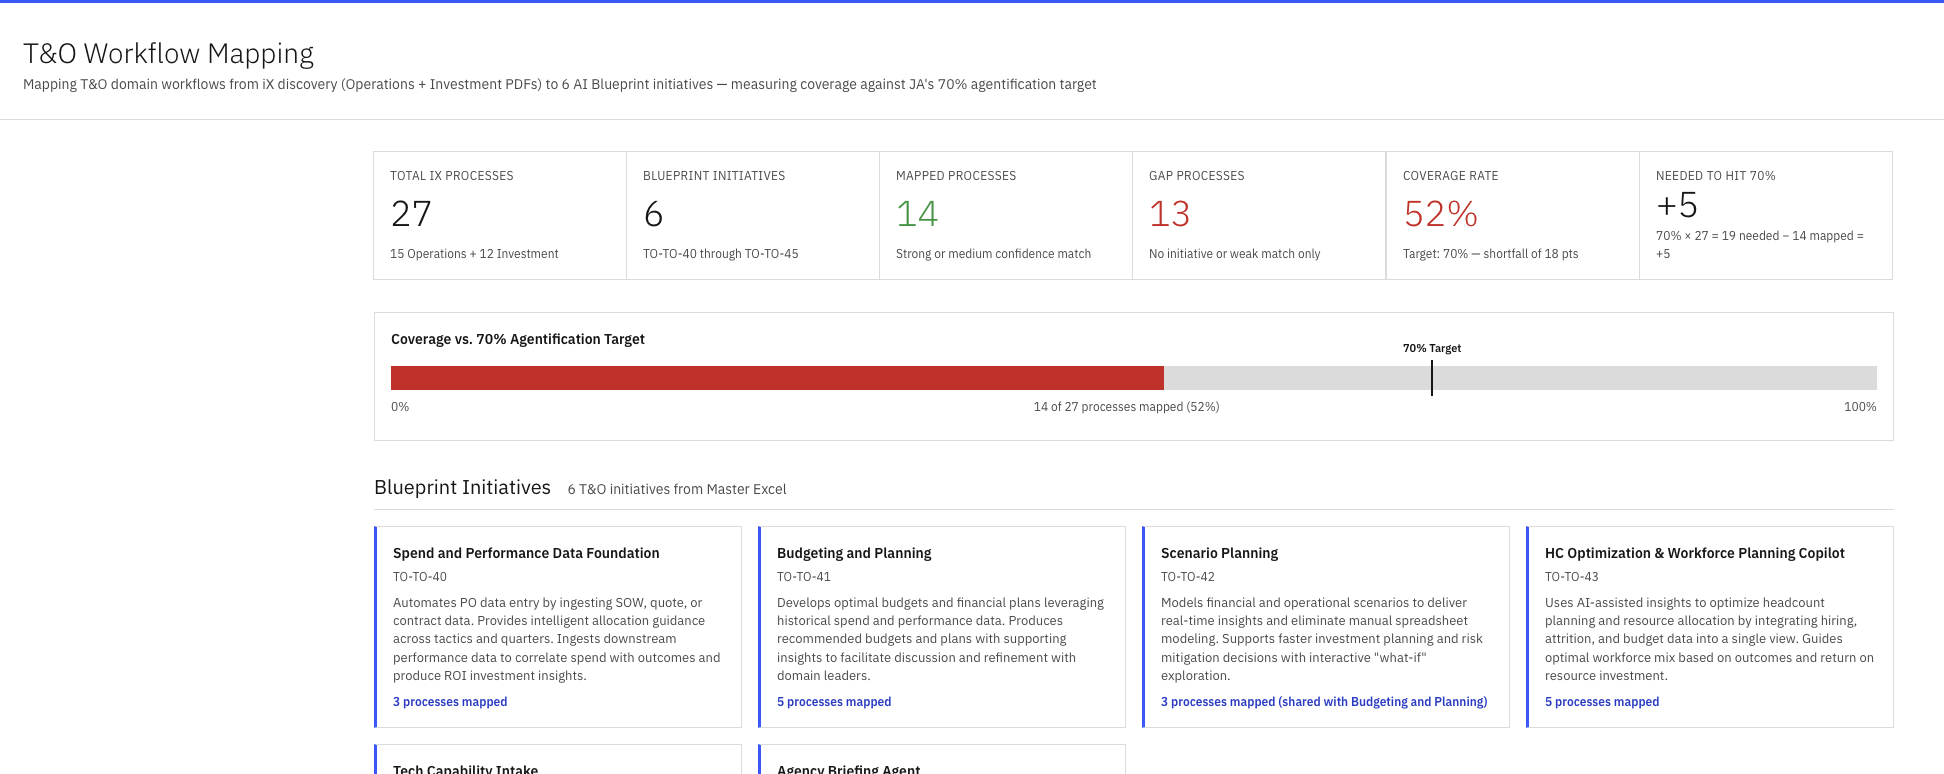
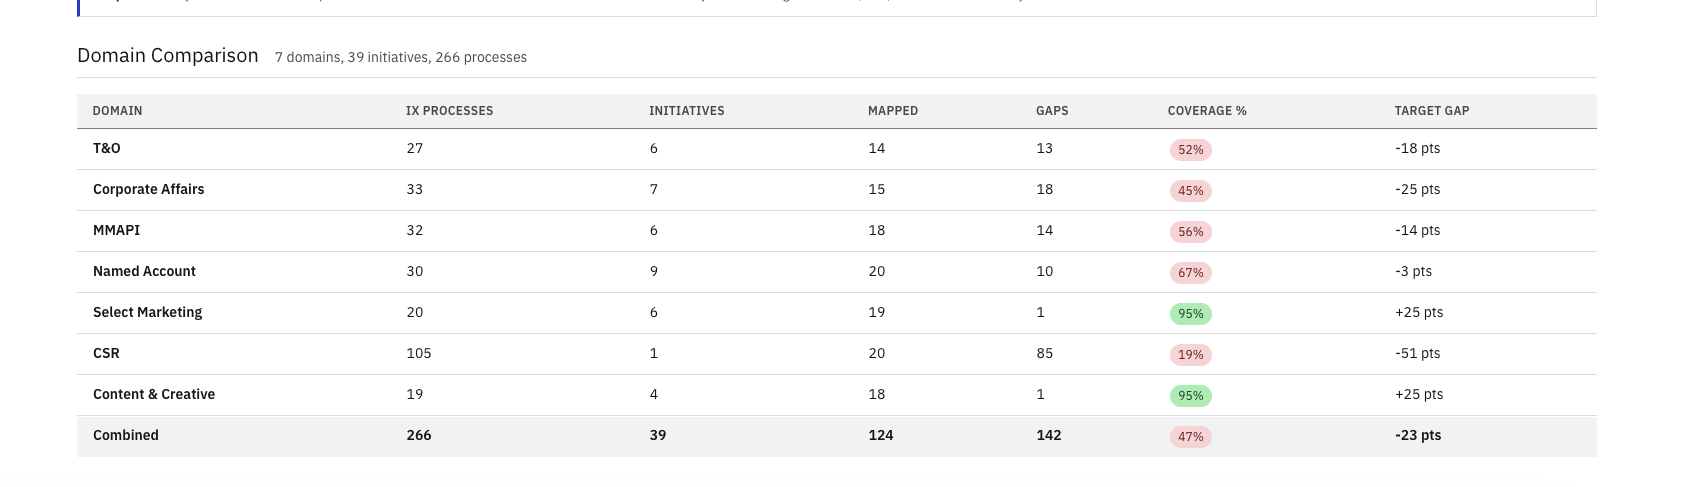
Once all nine domains ran through the skill, the coverage spread became the story. Aggregate coverage landed at 82% — twelve points above the 70% agentification target. Six of nine domains cleared the target on their own. The three that didn't — CSR, Content & Creative, and PMM — were all within ten points, making them a focused backlog rather than a structural problem.
The variance still pointed at the next round of strategy work. The blueprint either needed to expand to close those three pockets, or explicitly de-scope them. Either answer was actionable. Until this view existed, neither answer was possible.
| Domain | Coverage vs. 70% target | % |
|---|---|---|
| Marketing & Automation | 91% | |
| Named Account | 90% | |
| MMAPI | 89% | |
| T&O | 87% | |
| Corporate Affairs | 82% | |
| Select Marketing | 82% | |
| PMM | 67% | |
| Content & Creative | 65% | |
| CSR | 63% |
The coverage map surfaced the gaps. The harder question stakeholders asked next was the expensive one: how do we actually build 41 initiatives without running 41 separate projects? I decomposed every initiative into its fundamental agentic parts, and the same building blocks kept appearing across every domain. Build each brick once, snap them together in different combinations, and 17 atomic components unlock 41 initiatives.
A Retriever built for the Executive Briefer is 80% of the Retriever for the RFI Ninja, the TL Engine, and the Agency Briefer. A Monitor built for Media Monitoring is the foundation for Trigger-Based Activation and Social Media Advocacy. The reuse multiplier is the entire investment thesis — and the part the blueprint, on its own, could not make visible.
Same bricks, different variables. 17 reusable components does not mean 17 identical deployments. A Retriever for executive briefings searches different repositories, applies different relevance weights, and formats output differently than a Retriever for RFI responses. A Monitor for Corp Affairs escalates crises in minutes; a Monitor for MMAPI flags data quality issues overnight. The architecture is reusable. The configuration isn't. That's how 17 primitives serve 41 initiatives without 41 custom builds — and why the first wave focuses on nailing the bricks, not the buildings.
The default move would have been a deck. Decks were the wrong tool for this. 321 workflows, 41 initiatives, 9 domains, per-process mapping notes, coverage bars against a target, comparison tables, drill-in modals, and cross-domain views — there is no honest way to compress that into slides without throwing away the parts that make it useful. PowerPoint forces linear reading, flattens hierarchy, and turns every interactive question into a new slide.
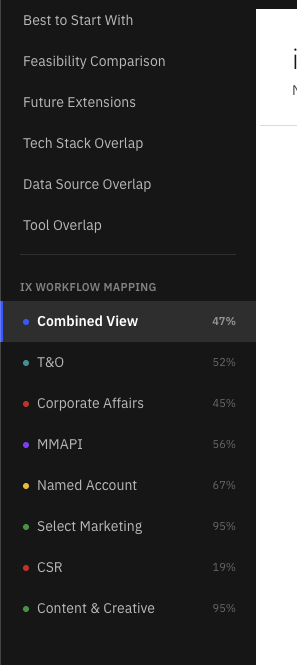
A web site with one page per domain handled the volume natively. Coverage charts rendered as actual charts. Modals opened on click for any process to show its mapping notes. Domains compared side by side in a sortable table. Every view was a hyperlink instead of a slide jump. And because it was a live URL, the only thing that ever needed to "update" was the URL itself — stakeholders bookmarked once and saw the latest state every time they returned. No re-distributing decks, no version sprawl, no "is this the current one?"
Getting from "a folder of PDFs" to a site that could carry that much density wasn't a code problem, it was a design problem. I worked it the same way I'd work any product surface: built UX flows in Figma to figure out how stakeholders would move between the combined view, the per-domain pages, and the per-process drill-ins; defined an internal design system (type scale, color tokens, card patterns, table treatments, modal behavior) so every fragment the skill emitted looked like it belonged to the same product; and only then wrote the templates the skill would render against. The skill produces consistent output because the design system gave it consistent rules to follow.
An index.html shell holds the navigation and shared chrome. Each domain is a self-contained HTML fragment loaded via fetch. Adding a domain means dropping a new fragment and adding one nav item. No framework, no build step, no cold starts.
The whole loop, from "new PDF arrives" to "stakeholders can read it on the live URL," is minutes. No local dev server. No build pipeline. The same Railway pattern I use for RepoIntel and the rest of my prototypes.
More than the artifact, the system it was built on is the part that lasts. The next domain doesn't require a new project. It requires running the skill. The next stakeholder doesn't need a meeting. They need a URL. That is the version of AI tooling I want to keep building: repeatable systems that compress weeks of analysis into a single command, and ship the output somewhere humans can actually read it.